
Build interactive dashboards and charts from databases and APIs using a no-code interface for data visualization.
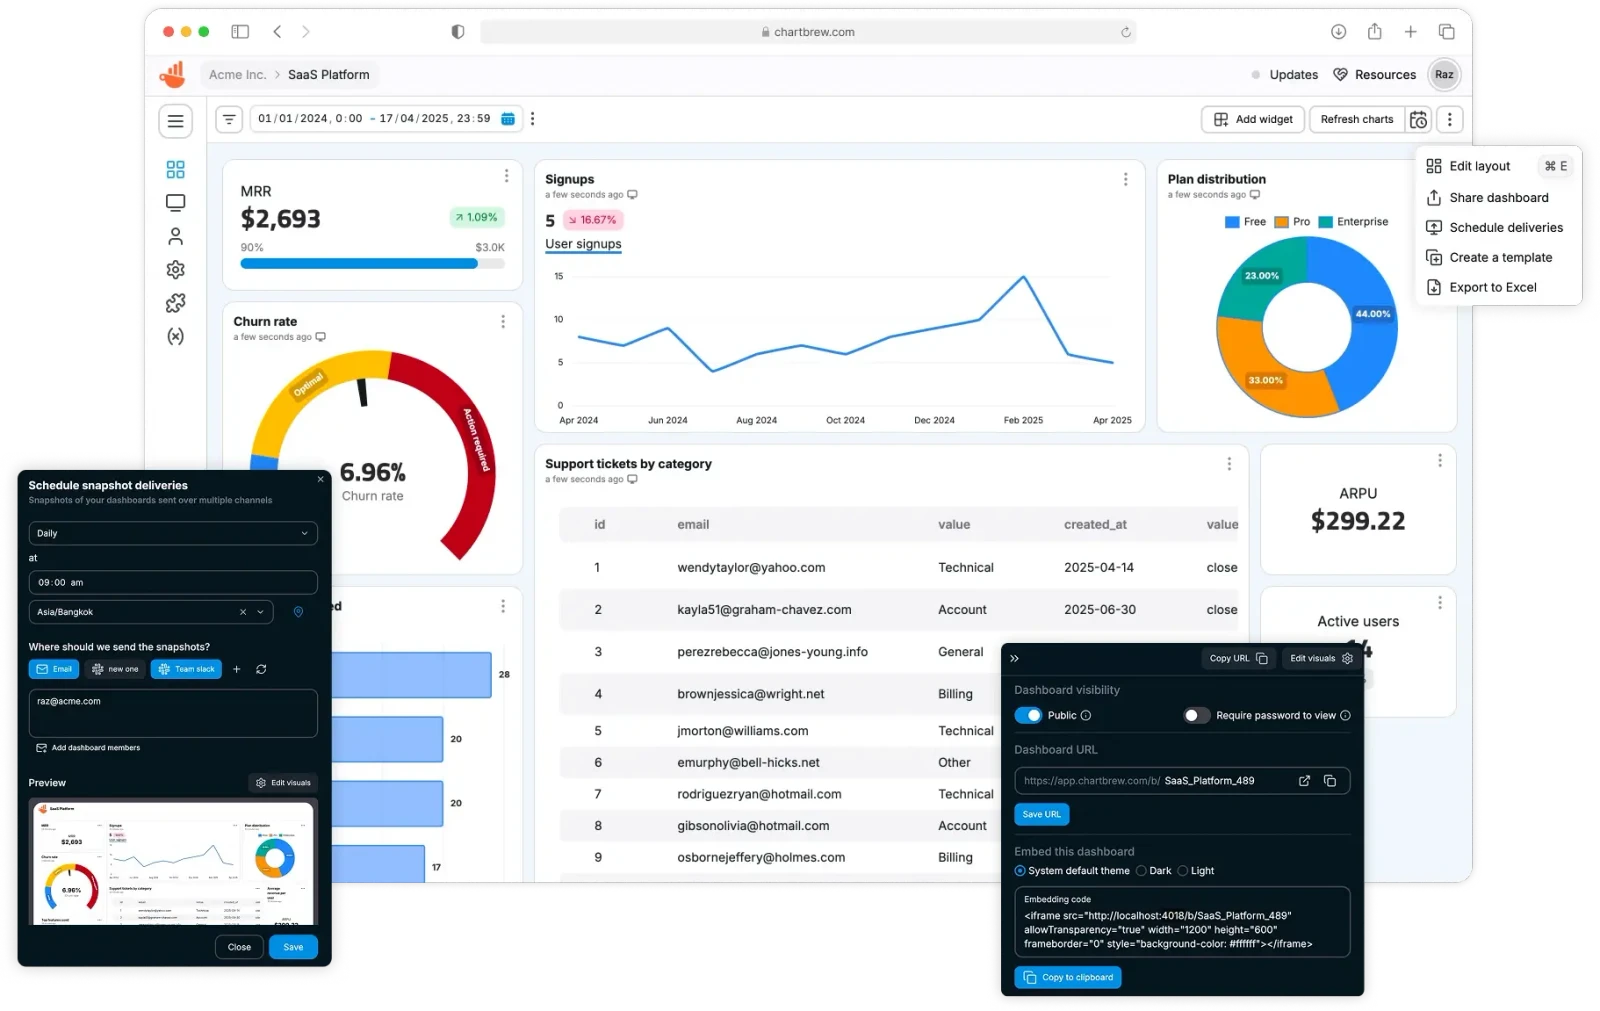
Chartbrew is an open-source web application that allows users to build interactive dashboards and charts. It connects directly to databases and APIs to visualize data without requiring custom code. The platform serves as a centralized hub for data visualization, enabling users to transform raw data from various sources into visual reports.
The software is deployed as a self-hosted web application. It can be installed locally via Node.js, deployed using Docker containers, or set up through a DigitalOcean one-click droplet for faster deployment. Users manage their data connections, write queries, and organize visualization layouts through a browser-based interface, making it accessible for those who need a visual layer over their existing data infrastructure.
Key features
- Direct connection to databases and APIs
- Visual chart builder for creating data representations
- Editable dashboards for organizing multiple charts
- Ability to embed charts into other applications
- Dedicated query and requests editor for data retrieval
- Team capabilities for collaborative dashboard management
- Support for MySQL and PostgreSQL databases
- Integration with Redis for system performance
The application architecture consists of a React frontend and a Node.js backend. It is designed for teams and individuals who need to aggregate data from various sources into a single visual interface without writing extensive frontend code. To function, the system requires a MySQL or PostgreSQL instance to store its own internal configuration, user accounts, and dashboard settings. The inclusion of a query editor allows for precise control over how data is fetched from the connected sources before it is passed to the chart builder.
Chartbrew serves as a low-code business intelligence platform for those who prefer self-hosting their analytics infrastructure and maintaining full control over their data pipelines.
Similar Open Source Software

Apache Superset
Connect SQL databases to build interactive charts and dashboards through a no-code interface or raw SQL queries.

Metabase
A business intelligence platform for data exploration and visualization that allows users to query databases without SQL.


Join our newsletter to get shiny new open source software delivered to your inbox. Unsubscribe anytime.