
An observability platform for querying, visualizing, and alerting on metrics stored across multiple different data sources.
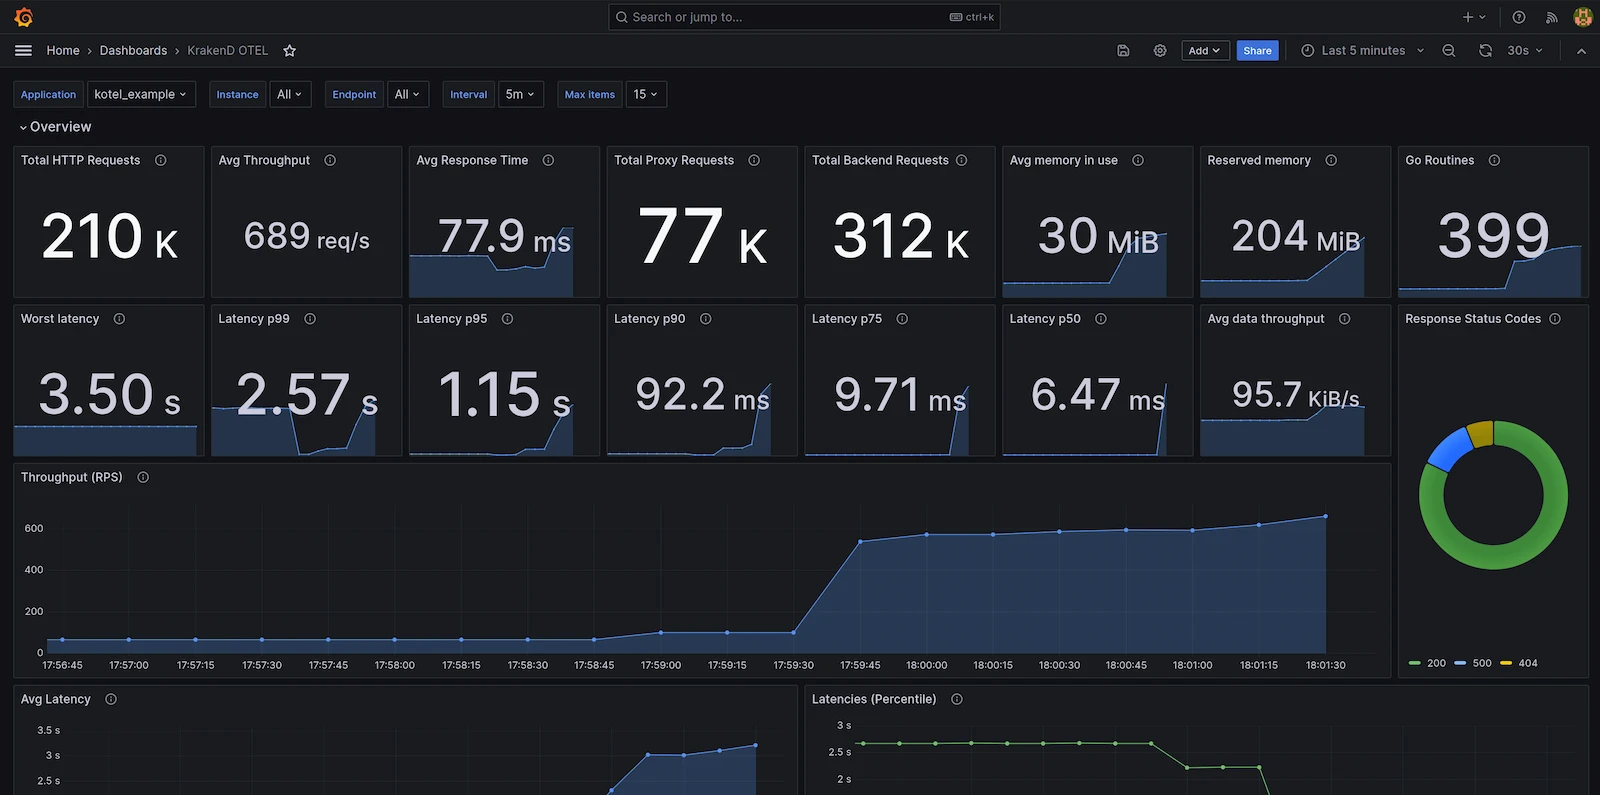
Grafana is an open-source web application and server that provides a platform for monitoring and observability. It functions as a web application and server that allows users to query, visualize, and alert on metrics regardless of where the data is stored. The software is typically deployed on a server to create and share interactive dashboards, serving as a central hub for infrastructure monitoring, performance tracking, and business intelligence by connecting to various external databases and telemetry sources.
Users employ the platform to foster a data-driven culture within teams by transforming raw metrics into visual insights. The application supports a variety of deployment environments and can be integrated into existing monitoring stacks to provide a unified view of system health. It is used for both high-level business intelligence reporting and deep-dive technical troubleshooting of server infrastructure and application performance.
Key features
- Client side graphs with various panel plugins for metrics and logs
- Reusable dashboards using template variables and dropdowns
- Ad-hoc queries and dynamic drilldown for data exploration
- Side by side comparison of different time ranges and data sources
- Log streaming and searching with preserved label filters
- Visual definition of alert rules with notifications to Slack and PagerDuty
- Ability to mix different data sources within a single graph
Grafana is built with Go and supports a wide range of data sources including Prometheus, Elasticsearch, InfluxDB, MySQL, and PostgreSQL. The architecture allows for per-query data source specification, meaning a single visualization can pull information from multiple backend systems simultaneously. This flexibility allows users to correlate data from different environments without needing to migrate all information into a single database. It is designed for DevOps engineers, system administrators, and data analysts who need to monitor system health or analyze time-series data in real time.
This tool is a flexible observability layer that decouples data visualization from data storage.
Similar Open Source Software

NetData
Real-time infrastructure monitoring with per-second metrics and automatic discovery for servers, containers, and cloud environments.

Stats
Monitor system performance and hardware health directly from the macOS menu bar with real-time data widgets.



Join our newsletter to get shiny new open source software delivered to your inbox. Unsubscribe anytime.