An OpenTelemetry based observability platform that integrates distributed tracing, metrics, and logs for monitoring complex systems.
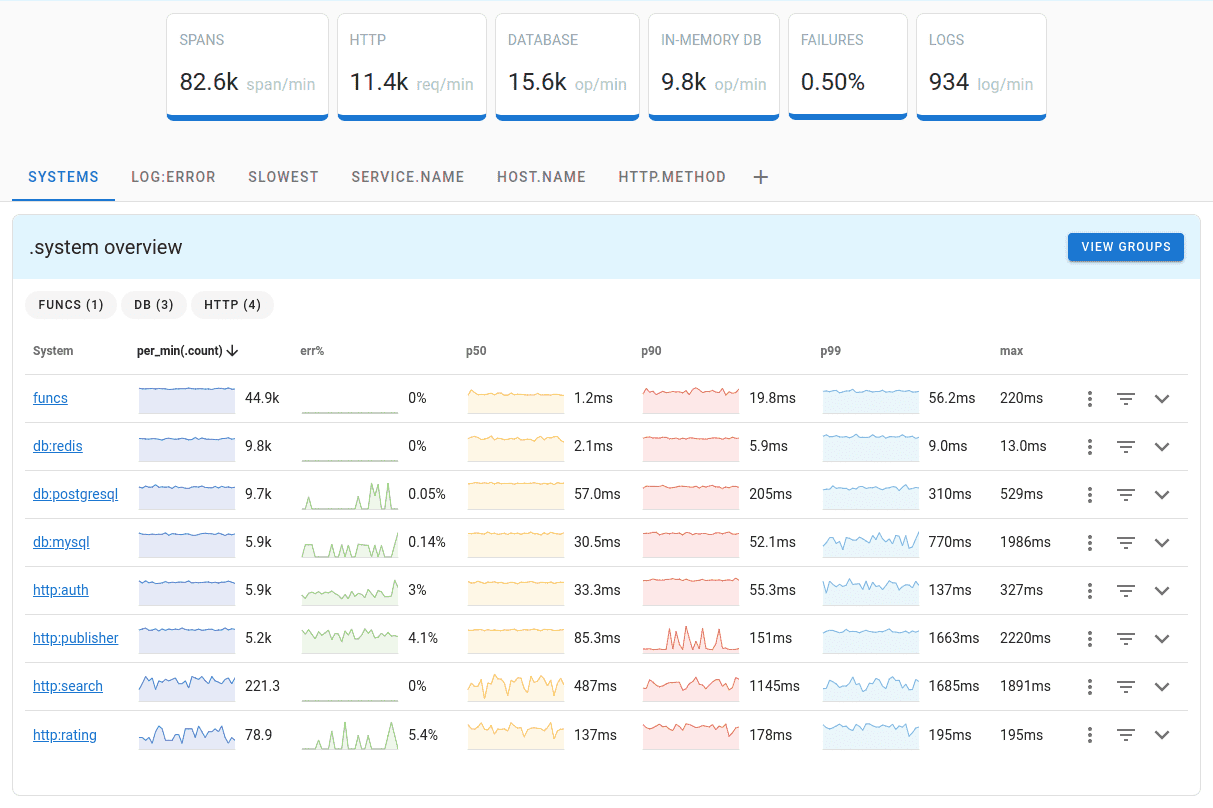
Uptrace is an open-source, self-hosted web app and server for application performance monitoring (APM). It provides a platform for application performance monitoring (APM) by integrating distributed tracing, metrics, and logs into a single interface to help monitor and troubleshoot distributed systems. The software enables teams to observe the behavior of their applications and identify bottlenecks in complex environments.
The software is deployed as a server and web application. It uses the OpenTelemetry framework for data collection and relies on ClickHouse for high-performance data storage and PostgreSQL for metadata, such as alert configurations and metric names. Users can run the system locally using Docker or deploy it as a dedicated monitoring server for their infrastructure.
Key features
- Unified user interface for traces, metrics, and logs
- Over 50 pre-built dashboards that generate automatically upon data ingestion
- Service graphs and chart annotations for visualizing system dependencies
- Notifications for spans, logs, and metrics via Email, Slack, WebHook, and AlertManager
- SQL-like query language for span aggregation and PromQL-like language for metrics
- Data ingestion support for OpenTelemetry, Prometheus, Vector, FluentBit, and CloudWatch
- Grafana compatibility allowing Uptrace to act as a Tempo or Prometheus datasource
- Single sign-on (SSO) integration via OpenID Connect including Keycloak and Google Cloud
- User and project management handled through YAML configuration
Uptrace is designed for high-volume data processing, capable of handling over 10,000 spans per second on a single CPU core. It utilizes aggressive on-disk compression to reduce the storage footprint of spans, compressing a 1KB span down to approximately 40 bytes. The architecture is built for users who require observability across multiple languages and frameworks while maintaining full control over their data storage and costs.
By combining tracing, metrics, and logging in one place, it serves as a comprehensive observability stack for teams managing complex distributed architectures and microservices.
Similar Open Source Software

SigNoz
Collects and correlates logs, metrics, and traces in a single interface for microservices observability and troubleshooting.

Arize Phoenix
Trace, evaluate, and optimize LLM applications with an observability platform featuring prompt management and dataset versioning.

Join our newsletter to get shiny new open source software delivered to your inbox. Unsubscribe anytime.